Shelter
Charity Project
Phases 1 and 2: Understand and Define
General Project Background
The charity project is part of the digital development career programme within the Home Office. My team's appointed charity was Shelter – a registered charity that helps people struggling with bad housing or homelessness through advice, support and legal services.
The Challenge
Shelter gave us a very specific brief. They previously had a data bank on their website that fell out of use and they wanted to replace it. The new data bank would allow Shelter employees to access housing data and filter it by location, housing need, supply and social welfare, as well as visualise key statistics.
Project overview
Team structure
- 4 Developers
- 1 QA Technician
- 1 Project Manager
- 2 Interaction Designers
- 1 Content Designer
- 4 User Researchers
My Role
- Supporting user research
- Preparing and facilitating ideation workshops
- Creating design artefacts
- Liaising between different team disciplines
- Stakeholder management
Time
- 6 months - 1 day a week (every Friday)
Design Tools
- Mural as collaboration tool for workshops
- Figma for creating designs
- Shelter Design System
Phase 1: Understanding the problem space
Our project team used the “design thinking” model during the course of the project, starting at the ‘understand’ phase.
As a team, we collectively agreed that we needed to understand the problems of the old database as well as our user groups better.
To start off, we mapped our assumptions based on the brief while the research team started recruiting for the initial round of user research.After the first round of research was concluded, the design team were able to extract user groups and main pain points.
Together with the other designers, I grouped the main issues that were found into three interlinked core categories that would become the basis of our problem statement: trust, reputation and accuracy.
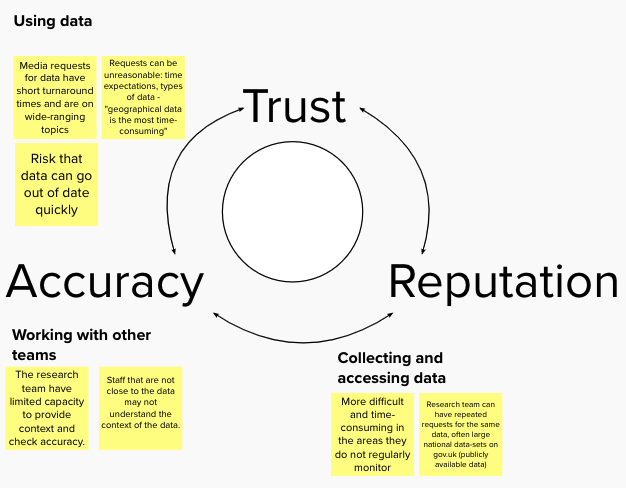
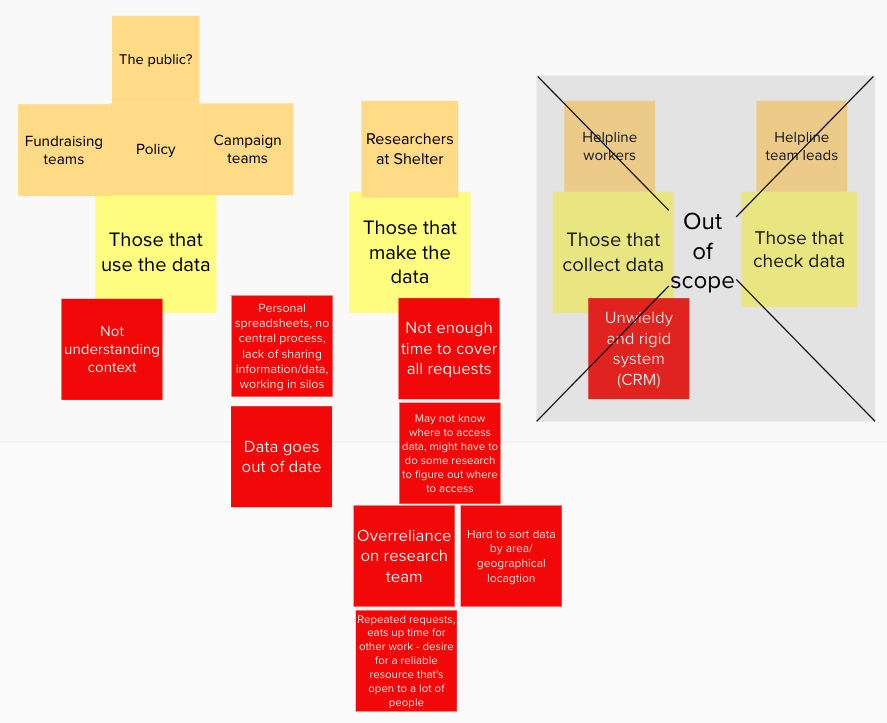
At this stage, we also identified our 2 core user groups:
- Data creators – researchers at Shelter who manipulate and provide data based on numbers from various sources.
- Data consumers – anyone that uses data in their work that isn’t a researcher. Those include fundraising, policy and campaign teams. This also could include the public as stats used in campaigns can be seen by anyone once they are published.
There was a third group we dubbed Data collectors and checkers which refers to helpline workers and their team leaders. When speaking to our stakeholders, we found out that Shelter was already working on improving their processes when it came to gathering data from the helpline so we instead focused on how we could improve relations between data creators and data consumers, as well as how we might improve processes to relieve any bottlenecks.
We shared our findings concerning the pain points and the central themes of accuracy, trust and reputation with the wider team before collectively deciding we could move on to the ‘define’ phase.
Phase 2: Define
In order to explore the problem space as well as potential opportunities, I organised a problem statements workshop together with the other designers. This also enabled our team to narrow the scope as the charity project had a strict deadline.
After creating a rough outline on what we’d do moving forward together with the PM on the team, I organised a workshop together with the other designers to define a problem statement and to explore the problem as well as any opportunities.
The workshop was structured as follows:
- A warm up exercise for the team
- A reminder on what we found out from analysis and a space to add any missing points
- Exploring opportunities: reframing our insights into opportunities using “how might we” statements
- Prioritisation and grouping: deciding what challenge we could tackle as a team after categorizing our “how might we” statements into groups and voting on them
From the results of this workshop, the designers co-wrote the problem statements for each of the themes that had emerged. I set up a meeting between all professions so we could collectively evaluate the statements.
We also played back our findings to the Shelter stakeholders. In order to create a clear narrative, I created storyboards and illustrations for this presentation.
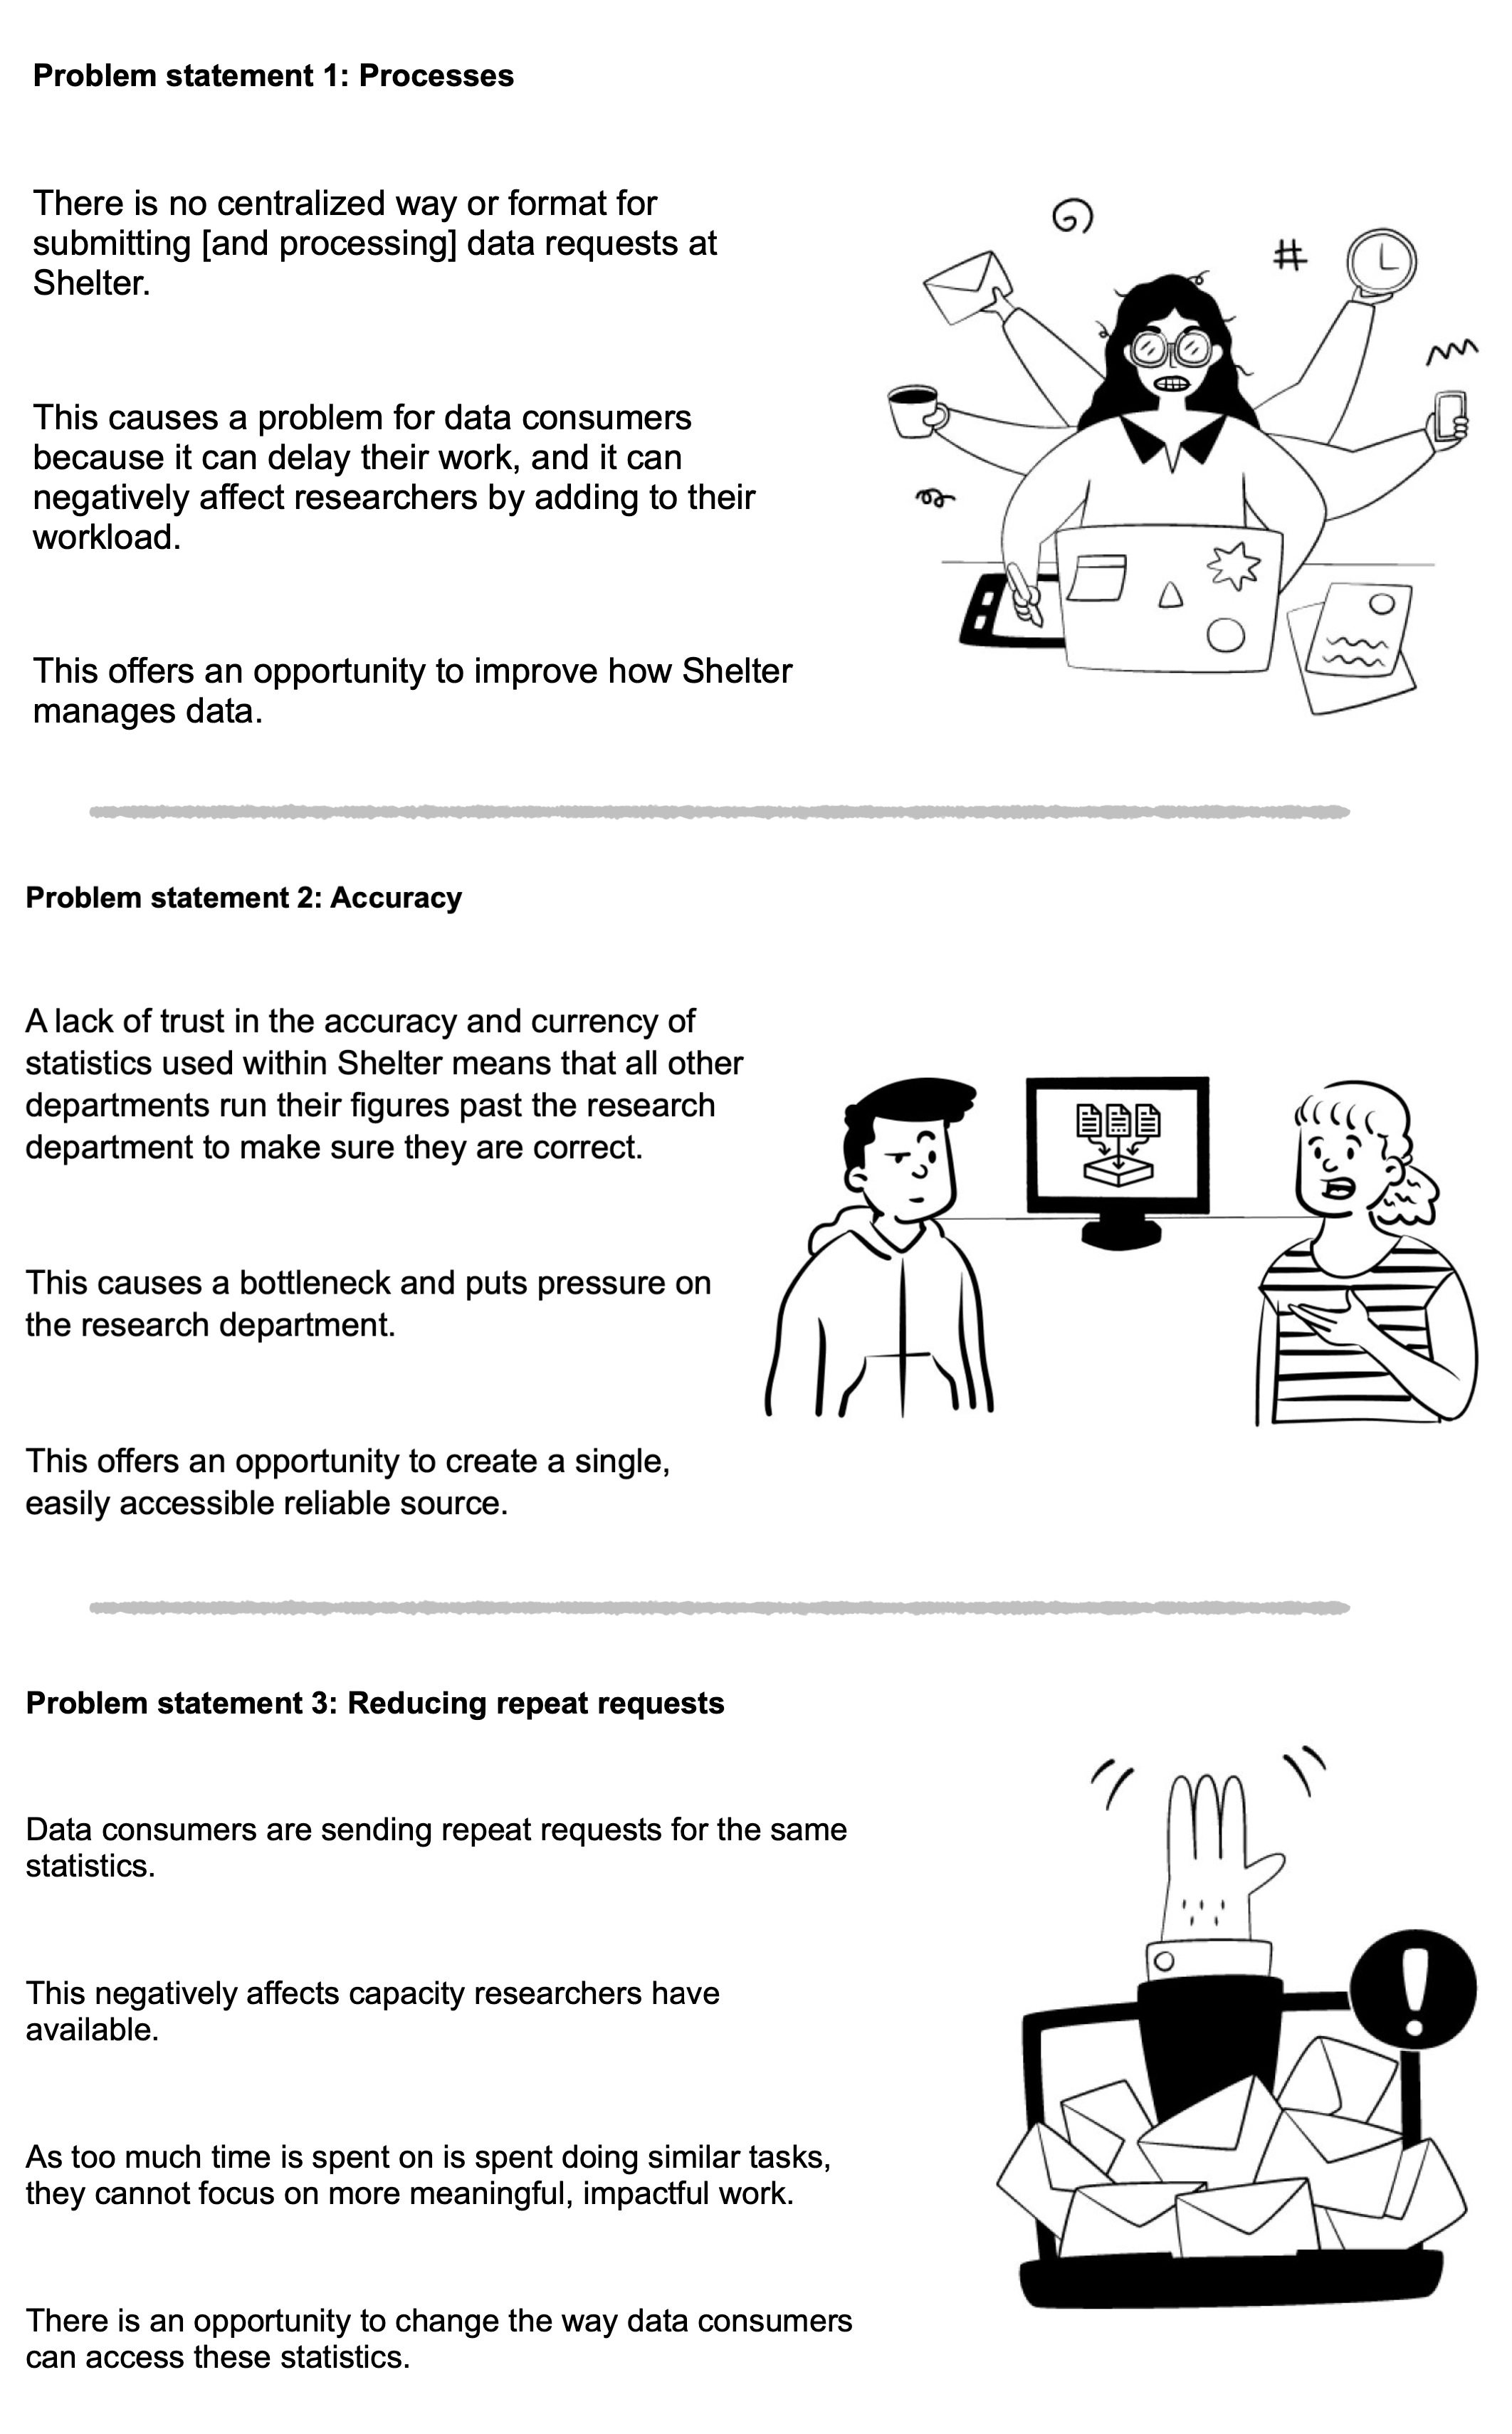
After our stakeholders cast their votes and the problem statement was established, the team was ready to jump into the ideation phase.
Phases 1 and 2: Understand and Define | → Phase 3: Ideation | → Phases 4 and 5: Iterative Design, Prototyping and Testing cycle
← Back to Portfolio Overview